The final episode of one of the biggest HBO’s TV shows: Game of Thrones aired last weekend. It doesn’t matter if you loved every episode of the 8th season, if you are part of the group that is asking for a complete do-over, or even if you’ve never heard the phrase “valar morghulis” in your life, today we bring you some fresh data about this TV show that you might find interesting.
The online behavior of our panelists in Spain changed in the past few weeks due to the launching of the eighth and final season of Game of Thrones. We've been very impressed with the data collected from our Behavioral Panel in Spain, made up of more than 10,000 people that share data daily - and with full consent - their online browsing habits on mobile and desktop devices.
Find out here how our panelists in Spain experienced this global event and the impact of the show on HBO’s website visits and the usage of HBO’s app.
This is not a #Spoiler: the number of visits to HBO.com increased notoriously in April.
It is no surprise: In Spain, the number of visitors of HBO (web and app) has surged higher than Daenerys’s dragons, with a 200% increase above the average number of visits since the launch of the first episode.
In fact, before the premiere, HBO’s daily reach among our panelists was between 1,5% and 2%, but since the broadcast of the first episode of the 8th season (Winterfell), the reach increased to 4,5% (Monday, April 15th).
When the rest of the episodes were aired and available in the streaming platform, we were able to see visit peaks to the HBO’s website and app, around the days the episodes premiered.
Game of Thrones has been a global phenomenon, for the first time, TV content has been seen simultaneously in many countries. However, due to timezone differences, Mondays became the day Spanish people watched the show, not Sunday nights, like in the US.
The longest ‘day’: HBO visits’ Heatmap
But, at what time of the day did our Spanish panelists enjoy (or not) watching King’s Landing burn? Our heatmap tells us the main hours Netquest panelists visited HBO on their browsers to watch every episode.
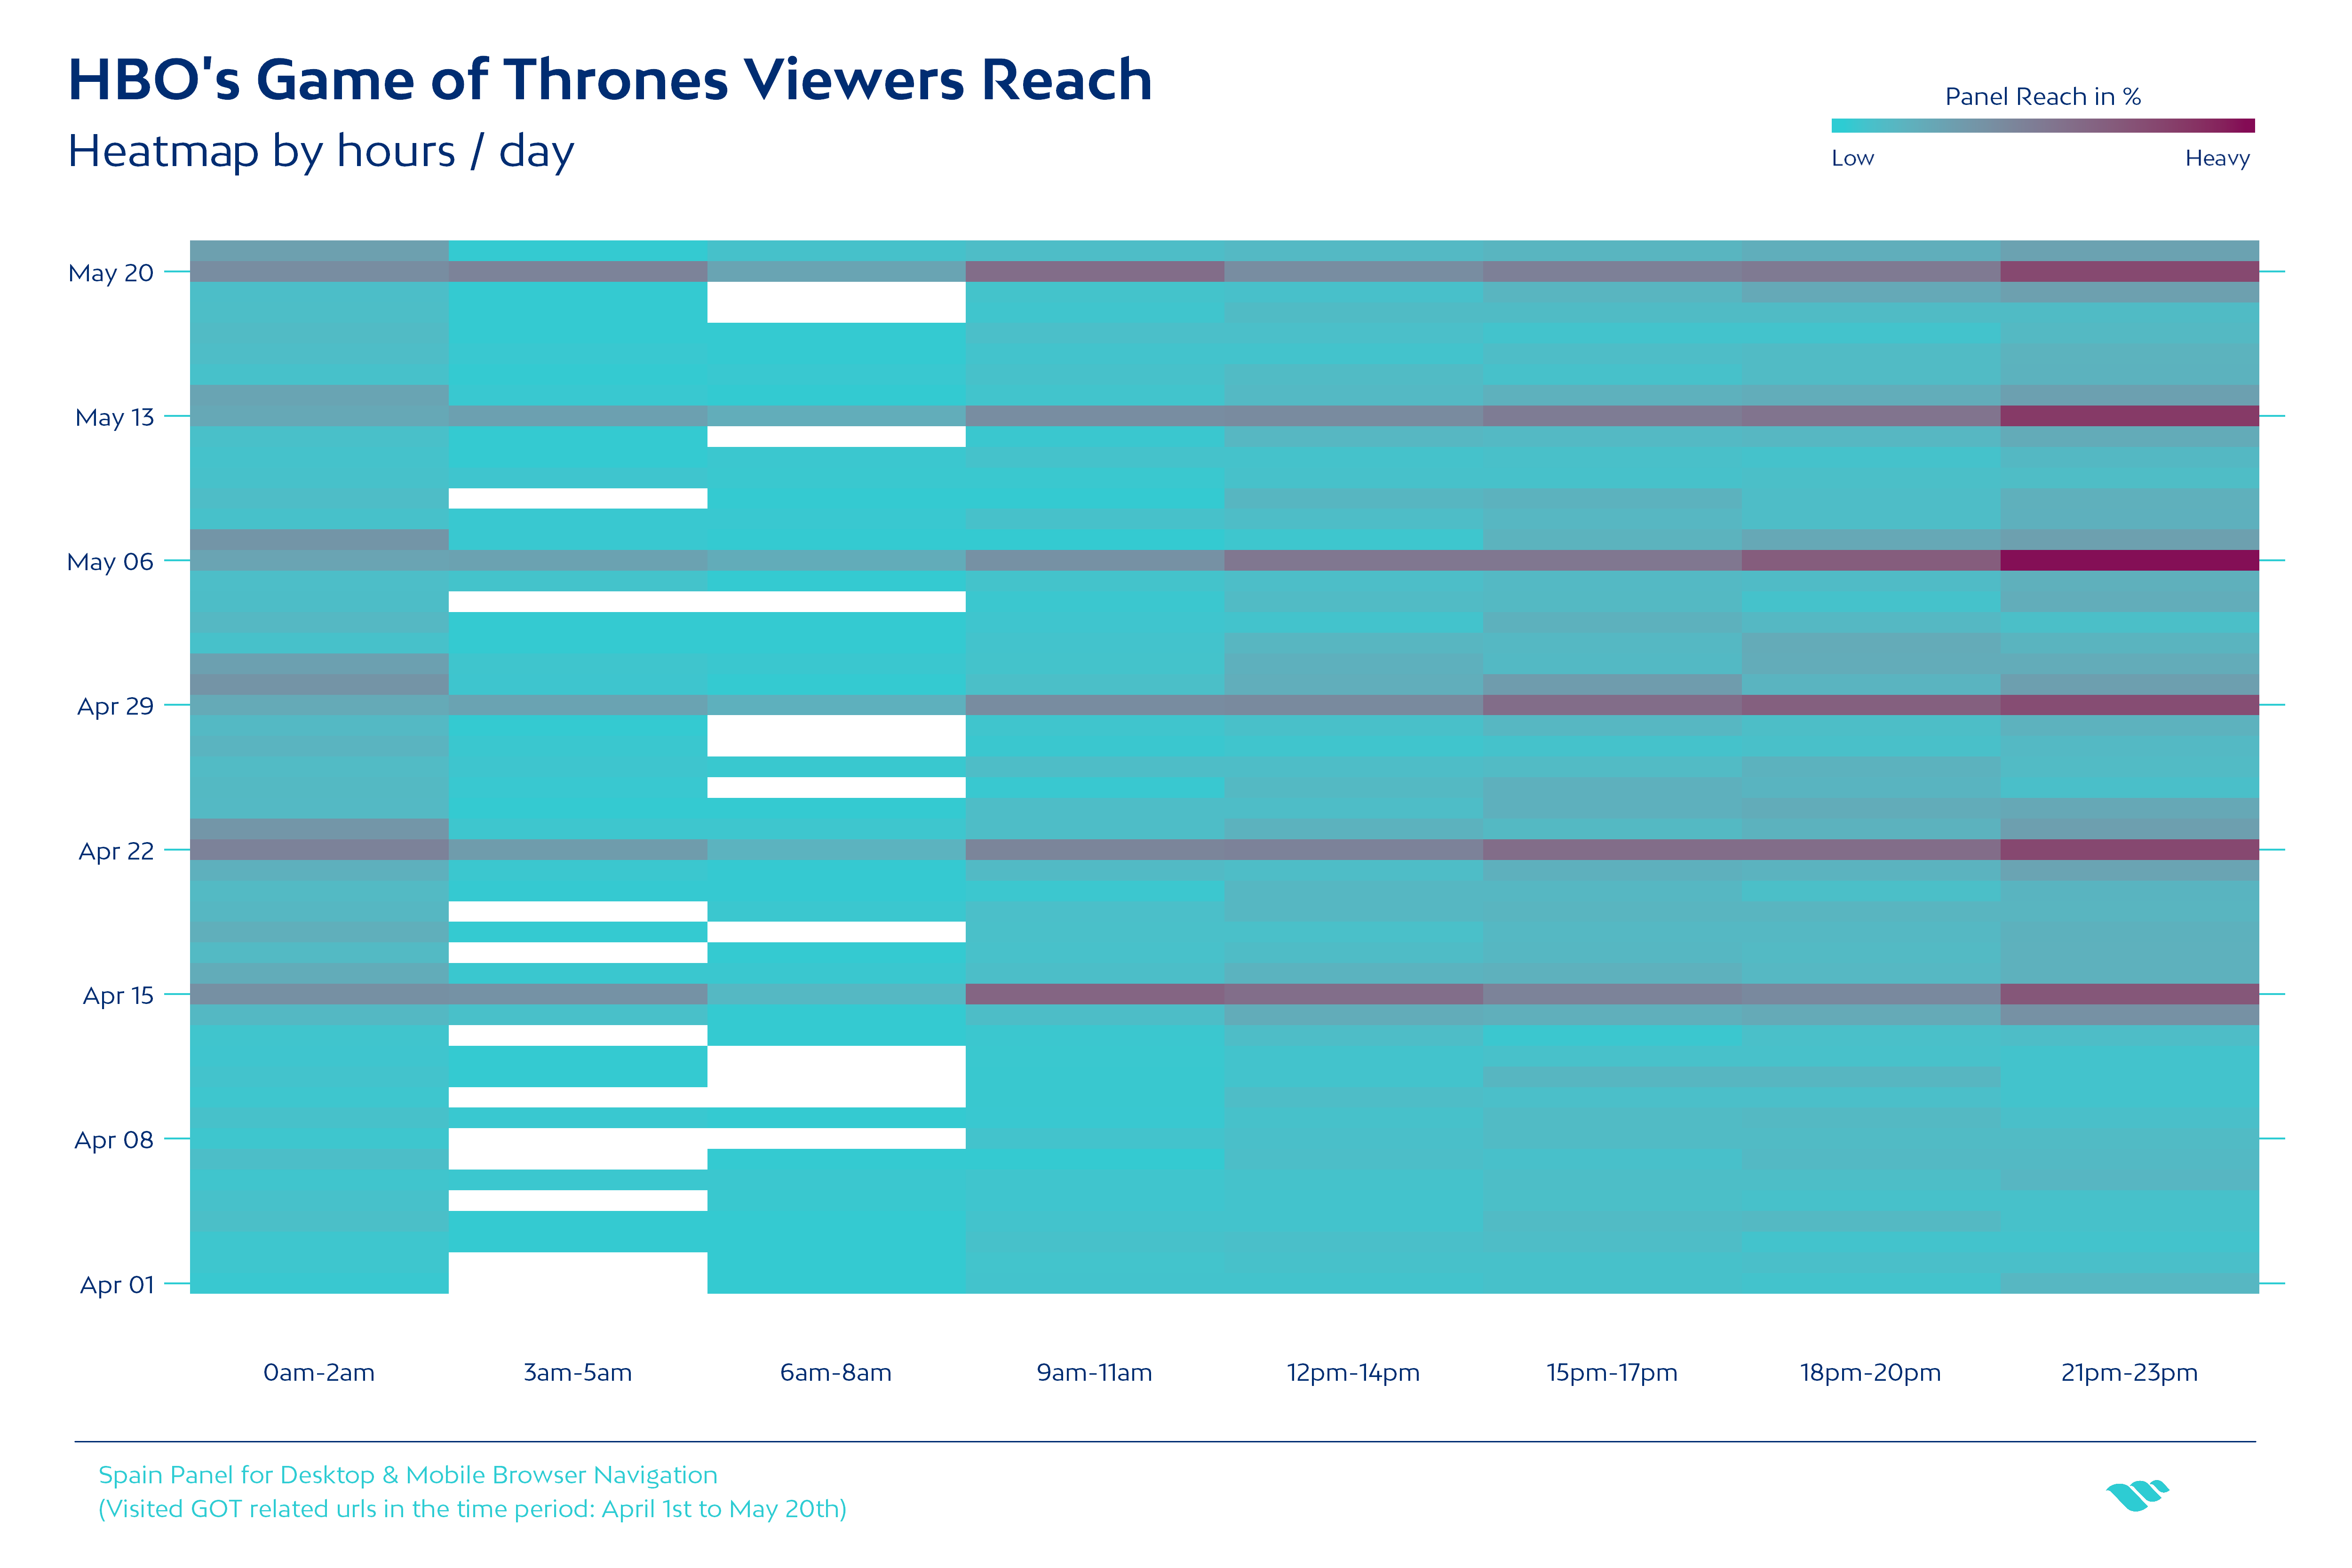
Very few of our panelists in Spain visited HBO in the early morning hours when each new episode was available in the platform: only 16% of them.

The majority - 56% of our Spanish panelists - sat in front of the screen between 9:00 and 11:00 pm on Monday nights, hoping they were lucky enough to not see any spoilers throughout the day (but that is something we cannot tell you with Behavioral Data).
And how were we able to create this heatmap? Thanks to clickstream data collected that showed when our panelists visited an HBO domain.
Here’s an example of how this clickstream data looks like:
|
panelist_id |
used_at |
url |
|
X |
05/04/2019 8:34 |
es.hboespana.com/series/juego-de-tronos/season-7/episode-2/3b1f95c-00c62afff6c/play |
|
X |
15/04/2019 6:55 |
es.hboespana.com/series/game-of-thrones-v3/e9279ec7-dde3-4aef-b4fb-fc2c7f5f3b19 |
|
X |
15/04/2019 7:36 |
es.hboespana.com/series/juego-de-tronos/season-8/episode-1/3b1f95c-010995be7cc/play |
|
X |
15/04/2019 16:36 |
es.hboespana.com/series/juego-de-tronos/season-8/episode-1/3b1f95c-010995be7cc/play |
Beyond the wall: What has been GOT impact on HBO’s digital platforms?
There’s one thing we can’t deny and it is that GOT has been really profitable for HBO (not only in Spain). It has certainly impacted the growth of its streaming platforms over the last years.
We started our Behavioral Panels in 2016 and that’s the reason we have back-data on app usage and HBO visits for the last 3 years. And in Spain, HBO started its streaming service back in November 2016.
The number of people in our Spanish panel that visited HBO or used the app (Android or iOS) around the time the seventh season premiered - mid-July 2017 - was about 6,7%. This same number was much bigger by the premiere of the eighth season in April 2019, when it had a monthly reach of 10,4%.
This means we saw a 55% increase on visits to HBO.com from our panelists, in approximately a year and a half.
Now that all the white walkers are dead and many of your favorite characters too, we are still left to see if there will be life beyond the wall. So we ask ourselves: how will this graph look in a few months?
There are many questions still to answer, for example: For us living in Spain, what will we watch on Monday nights now that GOT is over? The question remains open because there are some things data cannot help us predict.
------
In the meantime, would you like to know more about how to use Behavioural Data and how to measure the reach of other online streaming platforms? If so, you can download our Use Case about Netflix’s reach in Netquest Panels.