 Netflix was founded in the US in 1997. The company started a streaming service ten years later, went multidevice in 2010, and reached 190 countries by 2019 with 137 million registered accounts. Their strategy: a focus on local content creation and creative data applications.
Nobody can deny that the worldwide growth of Netflix has been huge. But exactly just how big?
According to Cindy Holland, Netflix's Vice President of Original Content, the average subscriber spends almost 2 hours a day watching their favorite shows on multiple devices, rather than on mobile devices only. But the entertainment giant has not released much more data on the platform's specific use and growth.
So we turned
to our own source of data -our Behavioral Panels- to see if we could dig a little deeper into Netflix’s reach and its visitor profile in three of the markets where we operate: the US, Spain and the UK. This was achieved thanks to almost 16.000 panelists who anonymously share their online browsing habits with Netquest.
Netflix's reach in Netquest Panels: the growth of visits over time
 We started our Behavioral Panels in 2016 and, just like Netflix, we expanded quickly. This means we have back-data on online behavior from the beginning of each panel, and we can see how the platform’s reach has grown over time.
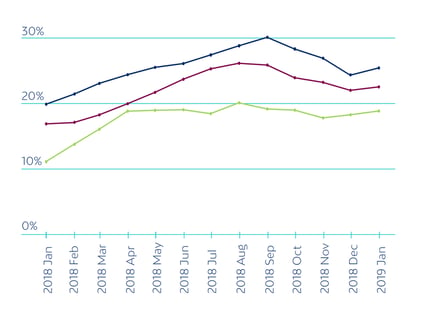
Reach is an analytic metric that refers to the number of users or consumers, who have seen or come across a particular content. Using reach as a metric we can compare different moments in time, as the panel size was not the same at any given moment.
In Spain the number of people on our panel that visited Netflix.com or used the Netflix App (Android or iOS) -at least once a month- went from 18,5 % at the beginning of 2017 to 27 % in 2019.
In the UK it went from 14 % to 20 % while in the US it went from 11 % to 21 %. In most countries, Netflix has almost doubled its reach within only 2 years.
How "addicted" are our panelists to Netflix?
Usage Rate Segmentation Based on Visits
If someone asked you how many times you visited Netflix last month, what would you say? Do you consider yourself a Heavy Netflix user?
Based on the average of monthly visits of panelists to Netflix.com or the Netflix App we created a segmentation to understand the platform’s use in every country. According to this, a Light user visits Netflix once or twice a month, a Medium user visits approximately two to ten times a month and a Heavy user is a panelist that visits Netflix more than ten times a month.
You can see our findings in the following chart: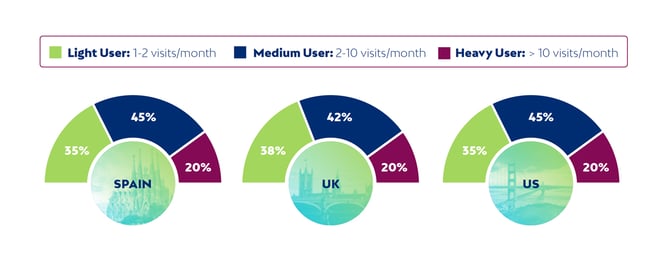
What’s very interesting to see is that there is similar behavior according to this segmentation across all 3 countries.
- In the US, 35% of the panelists are in the Light users segment, which means they visit the platform once or twice a month, while 45% are Medium and almost 20% are Heavy users, which means they visit the platform more than ten times a month.
- Similarly, in Spain, 35 % of our Spanish panelists are Light users, 45 % are Medium type users and 20% are Heavy users.
- And what about the UK? 38 % of our panelists are Light users, 42 % are medium type users and again 20% are heavy type users.
In all 3 countries it seems that 20% of our panelists visit the platform more than ten times a month. But how much time do they spend on the platform every time they visit it? That’s a question for another analysis, what we can know very easily is the profile and characteristics of the visitors in each country.
Who are the Netflix's Visitors in the US, Spain and the UK?
We can’t use the personal details of the people on our panels that use Netflix to find out more more about them, but what we do have is an ‘identifier’ of who carried out each of the online visits: the panelist ID. Since these visitors are Netquest panelists, we have tones of profile data we can use, and they’re associated with a unique panelist ID.
This means we can get a visitor’s profile by including some variables such as gender, age, and the device they used. Take a look at the gender distribution in each country according to their visit’s usage segmentation: 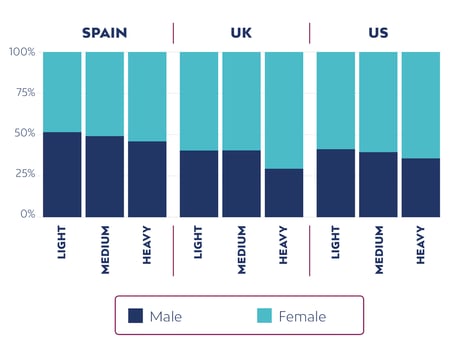 According to this graph most Medium users in the US and the UK are women (they visit Netflix between two and ten times a month) However, this differs in Spain, where there are almost the same number of women and men in the Medium segment.
But let’s add another layer of information and let’s go even a little further: what devices do Men and Women use in the US, Spain and the UK to visit Netflix? Take a look at the following graph:
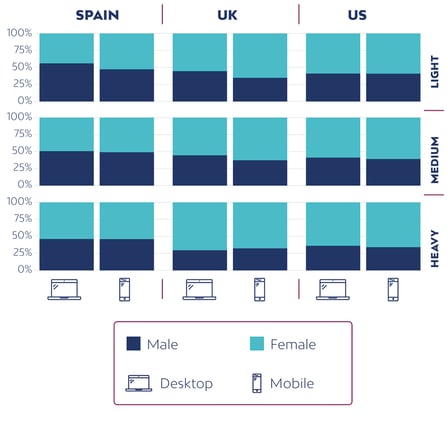 It looks like there are more visits from Mobile in the Medium user segment, rather than the Light or Heavy segments, for both Men and Women in the US, Spain and the UK.
Behavioral Data to measure websites reach
Next time someone tells you that he or she watches Netflix only once a month, or only an hour every other day, will you trust him or her? Behavioral data provides extensive information about what consumers do online (way better than just asking).
The behavior of online users can be better understood, analyzed, and quantified with data coming from methods of observation, especially in the case of websites reach.
We can see the apps consumers use, the websites and specific URLs they visit, along with the search terms they use, then use profiling data to fully understand an audience. This small Netflix analysis can be applied to all kinds of website types, whether streaming websites or media sites.
Could we take this analysis even further? Yes! And actually we’ve done it. The possibilities with a well profiled-panel are almost endless (just like the amount of shows you can binge watch on Netflix on a Sunday afternoon)
Download the following Use Case you’ll see how we’ve added variables like age into the mix and crossed all the data to create the most common a user profiles in each country: UK, US and Spain.