One of our web’s most visited sections is the SAMPLE CALCULATOR. Thanks to this application, you can get an estimation of the sample size you need for your survey just providing basic data about the population you want to investigate and the maximum error you are willing to tolerate.
We often receive enquiries about this calculator: which formulas does it use, what does margin of error mean, the confidence level… Today we aim to explain how it works exactly.

The problem
So this is the problem to be solved: we want to study a universe of people (for example, 15-65 year olds in Brazil from 136 million people) surveying a sample of that universe. As the sample is smaller than the universe, we are going to commit certain error. If we are willing to accept certain % of error, which is the minimum sample size I need?
The way I measure the error
When I want to set the maximum error I am willing to accept in a survey, we usually use 2 parameters: margin of error and confidence level. What do they mean?
The margin of error is the interval within I expect to find the value from the universe I am measuring. This figure can be either an average or a proportion. For instance, if I want to calculate the average number of children that Brazilian people from 15 to 65 years have, I would like to be able to say it is 2,1 children per individual with a 5% margin of error. This would mean I expect the average will be between 2,1 – 5% and 2,1 + 5% so it makes an interval of 2,00 <-> 2,21.
If I wanted to set a smaller margin of error for a proportion, I would do it in a similar way. For instance, imagine I would like to estimate how many people from 15 and 65 years old in Brazil live in an outright house. If we affirm they are 61,32 million people (45% of the population) with 5% margin of error, it really means it is about 68 million (50%) and 54,5 (40%)
The confidence level express how confident we feel about the value we look for is within the margin of error. For example, in the previous case, if we get a 95% confidence level, we could say the percentage of people who live in an outright house would be, in the 95% of the cases, between 40% and 50%. In other words, if I repeat 100 times my survey selecting the same random size samples, the proportion I am looking for would be within the interval 95% of the cases and it would be out the 5% remaining.
The link between sample size and error
Margin of error, confidence level and sample size are always linked. If I want to get a determined margin of error and confidence level (let’s say, 5% error and 95% confidence) I will need a minimum sample size according to it. To modify any of those values will change the others:
- Minimizing the margin of error will require a bigger sample size.
- Increasing the confidence level will require a bigger sample size.
- If my sample size gets bigger, I can either reduce my margin of error or increase my confidence level.
But, which formulas rule the relation between all the previous parameters? The theorems are related to this are called LAW OF LARGE NUMBERS. Those theorems support mathematically the following idea: the average of a random sample will tend to be in the middle of the population. In particular, the central limit theorem demonstrates that, in general, the addition of many independent random variables “is pretty close” to a normal distribution (also called “Gaussian Bell"). Thanks to this theorem, when calculating an average (e.g. number of children per person) or a proportion (e.g. % of people who live in an outright house), we can calculate the probability that our universe has that value or a similar one. The value we calculate from the sample is the most likely for the universe and, as long as we move away from it (either over or under), the values will be less and less probable.
For our example, if 45% of the sample of Brazilian people who live in an outright house, I can affirm that 45% is the most probable value of the universe under study. A 44% rate will be less probable, 43% even lesser etc. For superior values is exactly the same: 46% is lesser probable than 45% and so on.
The way the probability drops as we move away from the average corresponds with a Gaussian distribution. We can set an interval around the most likeable value so we include 95% of the probability (confidence level). The distance I need to set from the most likeable value to keep that 95% determines the margin error.
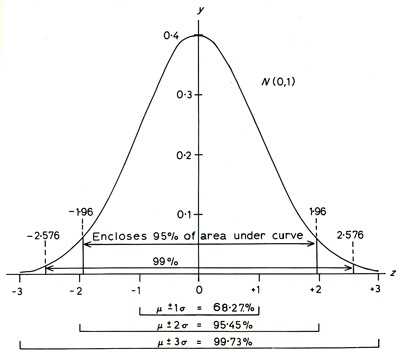
According to the previous graphic, for a normalized distribution (0 average, deviation 1) if we want to enclose values covering the 95% of the cases, I need to set a margin of error around the average between -1,96 and +1,96. If I want to cover 99% of the cases, our margin of error will increase to +-2,58.
So then, what is the calculator doing?
Adapting the Gaussian distribution formulas to any case is very easy (regardless which the values of the mean and the deviation are). We’re going to explain a proportion estimation in detail. For this purpose, we use this formula:
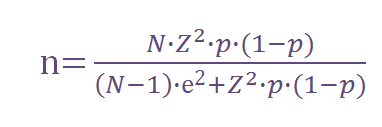
Where:
n = sample size to be calculated
N = size of the universe (e.g. 136 million of Brazilians between 15 y 65 years old)
Z = deviation from the mean value that we accept to get the desired confidence level. Depending on the confidence level we are willing to accept, we will need to use a determined value that comes from the Gaussian distribution. The more common ones are:
Confidence level 90% -> Z=1,645
Confidence level 95% -> Z=1,96
Confidence level 99% -> Z=2,575
e = maximum margin of error I tolerate (e.g. 5%)
p = proportion we expect to find. This parameter can be quite confusing at first sight: how can I put the proportion into the formula if the reason why I am doing this questionnaire is precisely to find this value?
The reason why p is in in the formula is: the more uniform the population is, the more precise the convergence of the normal population will be, so it allows me to reduce the sample’s size. In my example, If the maximum expected % of people living in an outright house is 5%, I could use this figure as the value of p and my required sample size would be reduced.
On the contrary, if I do not know at all what I can expect, the most cautious option would be to use the worst scenario, that if, population is divided equally between owners and non -owners, so p=50%.
As a general rule, we will use p=50% if we do not have any information about the value I expect to find when conducting my survey. If I have some, I will use the expected value (tending to 50% in case of doubt).
The previous formula can be simplified when working with very large universes (we consider them large when they are above 100.000 individuals). The result is the following:
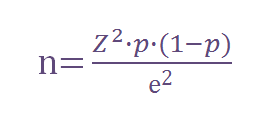
Example: returning to our previous case, we have a 136 million Brazilians population from 15 to 65 years old and we want to know how many of them live in an outright house with 5% margin of error and 95% confidence level. Supposing we do not have any other previous information about the % of owners we can get from the survey, we can use the simplified formula, as 136 million > 100.000, and we can use p=50% as we do not have previous information about the expected result:
n = 1,96^2 * 0,5 * (1 – 0,5) / 0,05^2 = 384,16 -> 384
So I should survey 384 people to keep me within the defined error levels.
In contrast, If we found in a study conducted last year that the % of owners was 20% and we expect the value to not have changed more than 5 points (between 15% and 25%), we could replace p for the worst scenario = 25%. The result will be:
n = 1,96^2 * 0,25 * (1 – 0,25) / 0,05^2 = 288,12 -> 288
So do I need to do those calculations?
No, that is why we have a calculator at your disposal which does all the work for you. You just need to know that the “level of heterogeneity” parameter is the expected proportion, so if you do not have it, you should indicate a 50% value.
We hope we have helped you interpreting how to use it.
---
Download our Ebook The Essentials of Online Data Collection to learn about how online data collection works and provides guidance in making choices of how to prepare an online research project.