Panel companies get data from people by offering a pretty simple deal. That is, participants, share their data with panel companies and panel companies pay them for that using one of the many available ways: money, sweepstakes, points that can be redeemed for gifts, etc. Netquest uses the last one: a complex points system to get gifts.
The way panel companies collect data from respondents used to be the questionnaire: a pretty simple and safe way for the respondents to report behaviors and opinions, although it requires a considerable amount of effort from them (time, cognitive effort).
But panel companies are evolving with time, asking new types of information through new data collection methods. Among them, the collection of online behaviors (e.g. visited web pages, search terms…) though passive metering is getting more interest from researchers. Online behaviors say a lot about people: preferences, interests, media consumption, purchases… And it has been proved that such information cannot be effectively collected through traditional questionnaires, mainly due to memory limitations (see “Using Passive Data From a Meter to Complement Survey Data in Order to Study Online Behavior”).
Another critical difference in collecting online behaviors compared to online surveys is the kind of value proposition that must be offered to participants in order to get their consent to share data. While online surveys require occasional efforts with a limited duration, sharing online behaviors requires an initial effort (the meter installation, a software that records what the user is doing while browsing the internet) but after that, data is gathered passively without intervention from the participant.
Finally, questionnaires and passive metering are different in a fundamental aspect. A questionnaire – especially if it is online - is usually not perceived as a threat to privacy. Participants taking a survey are in full control of their data, they decide what to share or not. And even if they share sensitive information, it is commonly accepted that panel companies will dissociate the identity of the respondent from the answers he/she provided. On the contrary, by accepting to install a meter, participants lose control of the information they are sharing as they are not actively deciding to share each piece of information the meter gathers. Of course, participants can stop the meter but, in practice, once the meter is installed, it is pretty easy to forget its existence. On top of that, how can a participant be sure that the meter is gathering only the browsing information? What about passwords, bank accounts and other sensitive information that is shown on screen? Of course, the meter is not collecting such data, but participants cannot possibly be 100% certain about that.
From our experience, it is much easier to get participants for surveys than people willing to share their online behaviors. At least, in the way we create online panels: we first recruit people to join a survey panel, then we ask them to install the meter. And even worse: the mere act of asking people to share their online behaviors may hurt the trust we build with survey participants. Panel members may raise questions like: Why are you asking me such sensitive information? Are you interested in getting personal information? What this information has to do with surveys?
After several experiments we reached two conclusions:
1. The more surveys participants take, the more likely they accept to install the meter.
2. Even improving our value proposition and communication to participants, some of them will never accept to install a meter. Or at least, not at a reasonable cost.
Knowing this, could we optimize the precise moment in the panelist lifetime when they are invited to install the meter, balancing the chances they accept with the sample needs we have? Could we avoid inviting people whose chances to accept are extremely low or, at least, prioritize people that are more likely to accept? By doing this, we would preserve people that are willing to take surveys but could abandon us simply by being invited to install the meter.
And here is when Machine Learning comes into action: to help us in predicting the likelihood of accepting the meter installation. The ingredients for such goal were already there:
1. Profiling information that all panel members provide when they join the panel.
2. Pasts experience trying to get their acceptance to install the meter in different conditions (e.g. when they had participated in one survey, two, three, etc.).
3. And of course, the successful installation rate for each individual in the past.
This is the perfect scenario for a supervised Machine Learning algorithm. It should predict the willingness to install the meter. The main predictors used to train the algorithm were, among a total of 32:
- Number of invitations to take surveys received before being invited to install the meter
- Number of participations
- Individual response rate (participations / invitations)
- Number of points earned by participating in surveys
- Number of points already redeemed
- Number of actual points
- Date of the last participation
- Country
- Other sociodemographic variables (gender, age, …)
The predicted variable, of course, is the successful installation of the meter (yes/no).
During the analysis, some constructed variables were added as predictors. These variables were built as a combination of the existing predictors. For instance, the variable “engage” is the result of a General Linear Model using invitations, participations, and total earned points.
Regarding the country of the participant, it is important to note that we are not training different models per country. Instead, the “country” variable is just another predictor that affects the predicted probability of installation by the algorithm.
We decided to use an XGBoost model, due to its high accuracy. Before training the model, all the categorical predictors were transformed using one-hot encoding. A total of 312,728 participants that were invited in the past (under different conditions) were used to train the model using cross-validation.
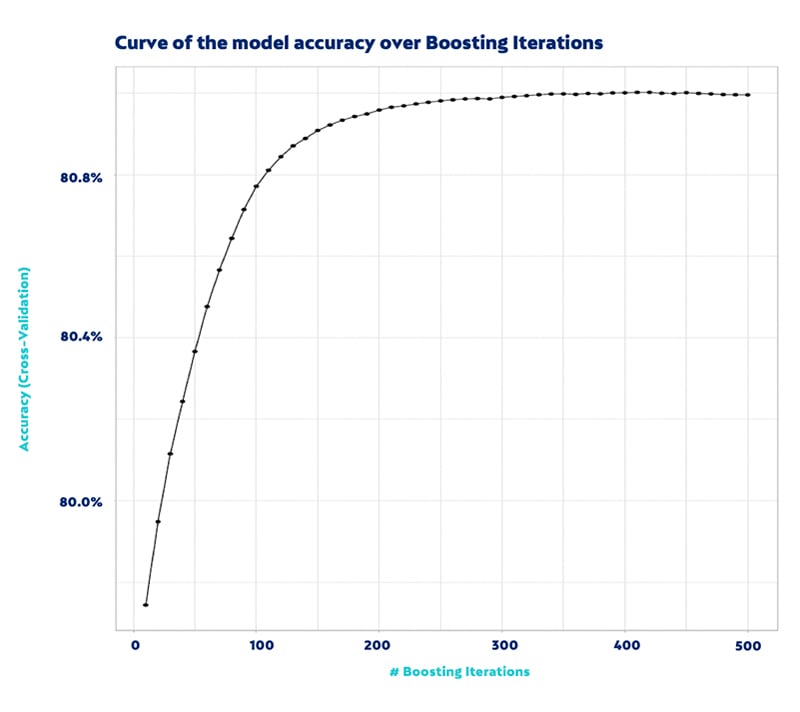
The algorithm performance we obtained was 81% of accuracy, with a specificity of 42%. The area under the ROC curve (a popular performance measure for Machine Learning solutions) vs the number of iterations used to train the model is shown below.
This result was not impressive, probably because we cannot access to some really predictive variables more related to personality traits (risk aversion, privacy concern, etc.). But this solution proved to be helpful to select panel members in both ends of the predicted willingness to install. Those panelists with higher probability could be the first ones to be invited, while those with lower probability could be discarded as potential participants to share online behaviors through a meter.
XGBoost is a high performing algorithm but its main drawback is its low interpretability. It is hard to understand how each predictor variable precisely affects the prediction. However, it is relatively simple to estimate the importance of each predictor in the outcome. By doing so, the three main predictors of a successful installation of the meter were the constructed variable “engage”, the total number of earned points and age, as can be seen in the next.
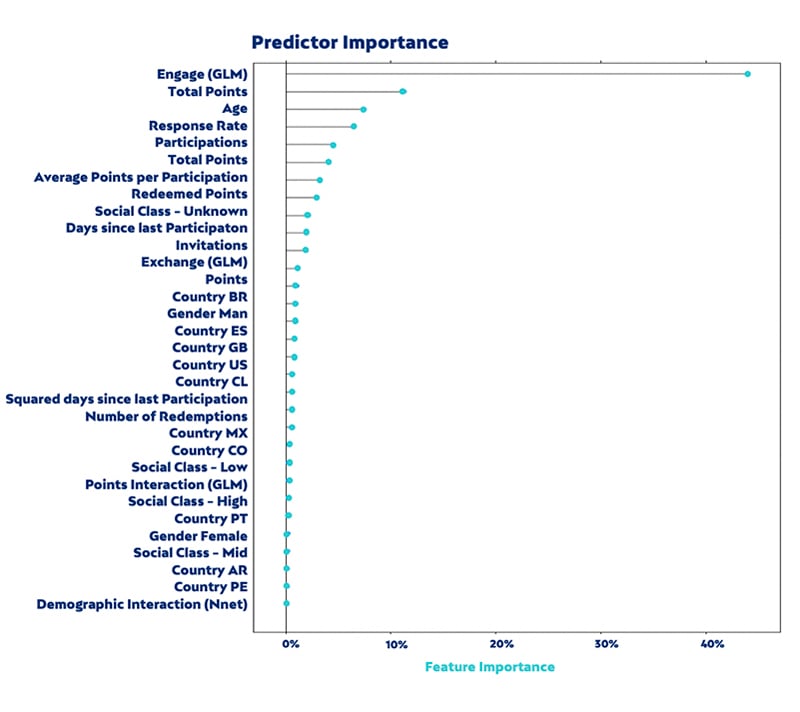
Note that each country is represented by a dummy variable (Country ES, Country GB, Country US…) that according to the above picture, has a limited impact on the prediction.
The main decisions made thanks to this algorithm were:
1. A threshold of 10 completed participation was set as the optimum to invite a panel member to install the meter. This quantity was decided as a good balance between the need to get more participants and a reasonably high likelihood of accepting the meter installation.
2. From a business point of view, a fixed number of participants with the meter installed is required for each country. In order to get and maintain such numbers, new panelists must be invited to install the meter. The new algorithm is used to prioritize the ones that are more likely to install the meter (among those that are eligible according to the 10 participations criteria).
3. In some specific situations and countries, due to special needs to accomplish some clients’ projects, we needed to invite people with less than 10 participations. Even in such cases, the algorithm proved to be useful to select the panelists that were more likely to accept the meter installation (with some exceptions where all the potential participants were invited, e.g. in the USA).
Conclusions
Developing an algorithm to predict the willingness to install a software that tracks online behaviors has proved to be useful to target the proposal (installing a meter) to the right people, at the right moment. Additionally, the developing of the algorithm has provided useful insights into what drives people to accept the installation. All the variables related to the past experience of the participants are those that best predict the installation acceptance, which reinforces our initial assumption that metering people is a matter of trust.