In a previous post we tried to explain how I should choose the sample size in order to ensure that the obtained result is within a controlled margin of error. Today we are going to deal with a related topic: when I observe a difference in a result obtained through a survey, how can I determine if that difference is statistically significant?
Is it real or is due to chance?
This is a question we ask ourselves frequently, even during day-to-day situations. Let’s suppose I normally go to my workplace by car along route A and I spend 25 minutes on average. I decide to try a new B route for a month and I observe it takes me 23 minutes. Is route B actually faster than A or, on the contrary, is that 2-minutes-difference due to chance? –For example, because of an especially fluid traffic during that week-. If the difference is not due to chance, it is termed a statistically significant difference.
There are numerous situations where we need to be sure that the differences we observe do not occur by chance. This idea is the essence of the scientific method. For instance, let’s think about a medical investigation. We want to check if a new medication produces the expected effect. So we dispense it to a sample of people and we compare the results against a sample of non-treated people, or even better, a sample of people treated with a placebo treatment. When I get the results, I need to be sure that the healing effect is real. These kind of tests are the ones that homeopathic products do not pass and also the reason why the medical community do not accept them as effective products.
With the advent of Internet, this working methodology became more trendy than ever. The A/B tests used for web pages development are a good example. For instance, imagine an e-commerce site where 5% of its visitants end up purchasing a product. I want to test if the increment of the images size will improve the sales conversion. Doing an A/B test consist on trying a new website version and randomly showing the users one out of both versions. If the new website has a 5,5% successful selling rate. can I be sure that the 0,5 % difference is because of bigger images?
Statistics are useful to answer those questions. We need to do a hypothesis test. Let’s see how it works.
Hypothesis test
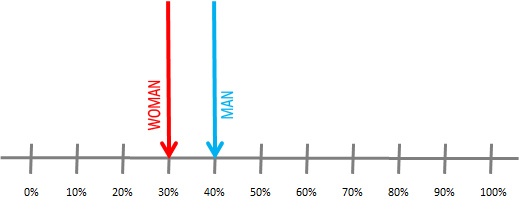
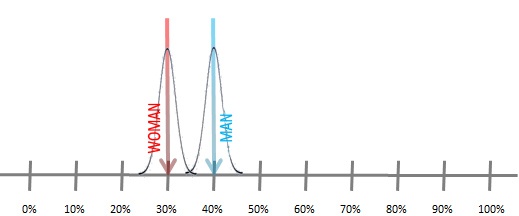
For a start, let’s see an intuitive approach. Suppose we survey 100 men and 100 women and we ask them if they do exercise. After analyzing their answers, we conclude that 40% of men do exercise while 30% of women do. We could represent that data in the following chart:
But as we saw in a previous post, this result is not perfectly precise, as we are using a sample of people instead of the whole universe: it will be within the margin of error. The smaller the sample is, the bigger the margin will be. That is why we should represent the survey result using this kind of graphic:
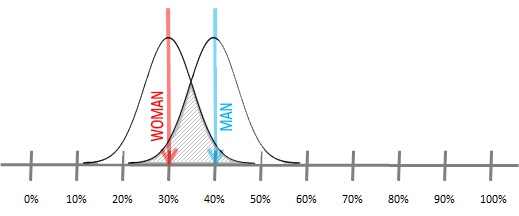
In this graphic we depict the uncertainty about the percentage of men and women doing sport. By using this vision, we see that the margins of error for both results overlap significantly. In the particular case we are using for our example, the graphic shows that the observed difference between men and woman can be unreal quite easily, so it could be an effect of the sampling error due to the use of a small sample size.
The grey part depicts that risk: it shows how likely is that the difference is due to sampling error. In this case, we would have a no-significant difference.
How could I be sure that the difference is truly statistically significant? Ideally, if the difference between women and men were bigger, so the margin of error of each result would be less overlap, I would be sure of this, as shown in the following graphic:
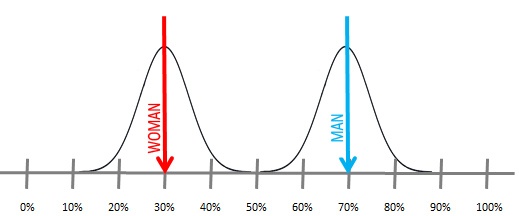
Obviously, this does not depend on me (researcher). So if I want to get more certainty about the significance of my observed difference, I would need to work with bigger sample sizes. In other words, if the expected difference is small, I need a bigger sample that will produce a smaller margin of error, allowing me to detect smaller significant differences, as shown in the next graphic:
Can I measure this in an objective way?
Yes: to do so, it is customary to use a hypothesis test, that is, an objective test about the cause of the difference. So first of all, let's define these quantities:
- Nh = men’s sample size
- Nm= women’s sample size
- Xh= number of men who do exercise
- Xm= number of woman who do exercise
By using these quantities, we must calculate first the overall proportion of people who do any sport, no matter if they are women or men::
- P = (Xh+Xm)/(Nh+Nm)
We must also calculate the proportion between men and women taking part in a sport, the result that we want to verify as it resulted different in both groups of population:
- Ph = Xh/Nh
- Pm = Xm/Nm
Then, we present the two possible hypothesis:
- H0 (null hypothesis) = there is no difference between both samples, the observed difference is due to chance.
- H1 (alternative hypothesis) = there is a statistically significant difference; both samples are truly different according to the studied variable.
To accept the alternative hypothesis the observed difference between both proportions (Ph and Pm) must be large enough to reach a sufficient confidence level % that allows me to ensure that the difference is not due to sampling error, assuming this error follows a normal or Gaussian distribution. To do this, I should calculate the following:

Then we have to check that Z does not exceed the quantity defined by the confidence level we wish. It is very common to work with a 95% confidence level, which corresponds to Z=1,96. Therefore:
- If Ztest<1,96, we accept there is NO a significant difference between women and men, with a 95% confidence level.
- On the contrary, we will accept there is a significant difference between both groups with a 95% confidence level.
Back to our previous example…
We can do those calculations in our initial example. Remember, 100 men and 100 women, 40 sportsmen and 30 sportswomen. We will have:
- Nh = 100.
- Nm = 100.
- Xh= 40.
- Xm= 30.
Those data result in Z=1,48 and it will not allow us to affirm the difference is significant as it is smaller than 1,96. If on the contrary this result were obtained using a 200 men and 200 women sample, Z would have been 2,10, enough for accepting the hypothesis.
Some final considerations
It is very important to take into account how big the sample I work with is. Sometimes, when using extremely small samples, we observe very large differences that, however, have no statistical significance. This does not mean the difference is not real, it just means we do not have enough evidence to know if it is real, according the provided data.
On the contrary, if we use extremely large samples, we can find very small significant differences that will not be very informative in practice.
Last of all, we will publish soon in Netquest a significant difference calculator to help you doing those calculations, as we already have a sample size calculator.